1.How to find a mean/median on a graph (and WHICH graphs contain mean/med)
2.How to determine a median from a frequency table
3.How to locate quartiles on a graph
4.How to calculate outliers using the 1.5 outlier test
5.How the mean/median/IQR/standard deviations CHANGE when taking outliers out of a data set
6.The difference between IQR and range
7.How to determine shape of a distribution from a graph, particularly boxplots
8.Standard deviation: what it is and what properties it holds
9.How to calculate a z-score
10.How to use z-score to estimate a percentage on a Normal curve
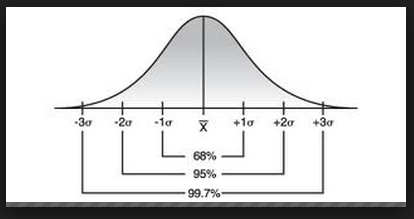
One thing that we talked about today that was not mentioned previously is called the Empirical Rule, or the 68-95-99.7 rule. It states that 68% of the data on a Normal curve should fall within the first standard deviation, 95% of the data should fall within the 2nd std. dev, and 99.7% should fall within the 3rd std. dev. Anything outside is considered an outlier (beyond 3 std. dev, so in other words, we would expect the z-score for an outlier to be above 3.0 or below -3.0)
See the picture below for more detail:
No comments:
Post a Comment